Why Measure QR Code ROI
Marketing teams often treat QR codes as an add-on — a low-cost extra tossed onto a poster or packaging. Because the marginal cost of generating a QR code is close to zero, the assumption is that any return at all makes them worthwhile. That assumption is dangerous. It ignores the real costs embedded in a QR campaign: the design time, the print runs, the dynamic QR service subscriptions, and the landing pages built to receive scan traffic.
Measuring ROI turns your QR codes from a "can't hurt" afterthought into a data-driven marketing channel. You can compare QR campaign performance against email, social, or paid ads. You can identify which placements deliver scans and which are wasted. And you can justify budget to scale what works. For a broader framework on building QR code campaigns strategically, see our pillar guide on QR code marketing strategy.
QR code ROI is not about the code itself — it's about the campaign the code enables. A QR code is a delivery mechanism. Its ROI depends on what happens after the scan: the landing page experience, the offer, and the conversion funnel.
The ROI Formula
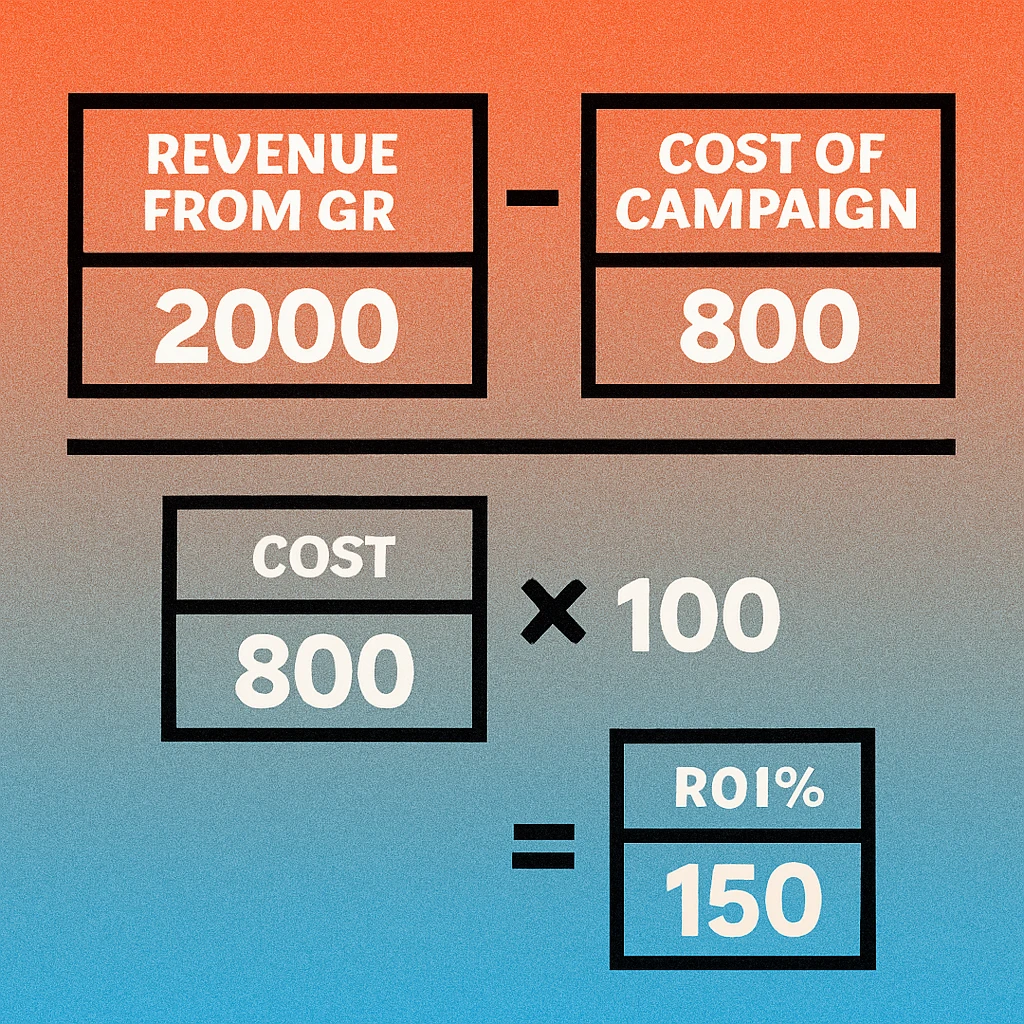
The basic ROI formula for any marketing campaign applies directly to QR codes. There's nothing exotic about the math — the challenge is accurately capturing costs and attributing revenue.
A result above 0% means the campaign generated more revenue than it cost.
Let's walk through a concrete example. A restaurant chain prints QR codes on 50,000 table tents linking to an online ordering page. Here are the numbers:
- Dynamic QR service: $29/month × 3 months = $87
- Graphic design: $150 (table tent layout + QR styling)
- Printing 50,000 table tents: $1,200
- Landing page development: $0 (used existing ordering page)
- Total campaign cost: $1,437
Over three months, the QR codes generated 4,200 scans. Of those, 840 resulted in completed orders (a 20% conversion rate) with an average order value of $22. That's $18,480 in attributed revenue.
Every dollar spent on the QR campaign returned $12.86 in revenue.
Not every campaign will show four-digit ROI. The key is building the habit of calculating it consistently so you can compare campaigns, placements, and time periods against each other.
Cost Components of a QR Campaign
Accurate ROI requires accurate cost accounting. Many marketers undercount costs by ignoring internal labour or amortised platform fees. Include every cost that wouldn't exist if the QR campaign didn't happen.
| Cost Category | Description | Typical Range |
|---|---|---|
| QR Design | Custom styling, brand colours, logo overlay, testing | $0 – $300 |
| Dynamic QR Service | Monthly platform fee for trackable, editable QR codes | $5 – $49/mo |
| Printing | Physical materials: flyers, packaging, signage, labels | $50 – $5,000+ |
| Distribution | Shipping printed materials, in-store placement labour | $0 – $2,000 |
| Landing Page | Design and development of QR-specific landing experience | $0 – $3,000 |
| Internal Labour | Staff time for campaign planning, setup, and monitoring | 2 – 20 hours |
For small campaigns — a single poster or a business card — the total cost might be under $50. For enterprise-scale campaigns involving custom packaging across thousands of SKUs, costs can run into the tens of thousands. The formula works the same regardless of scale; the discipline is in capturing every line item.
Don't compare QR campaign costs to a $0 baseline. Compare them to the cost of the alternative channel you would have used instead. If the QR code replaces a printed URL that nobody types, the real comparison is QR cost vs. lost engagement.
Revenue Attribution from QR Scans
The hardest part of QR ROI is connecting a scan to a dollar. Unlike paid digital ads where the click-to-conversion path is fully tracked, QR codes bridge the physical and digital worlds, and attribution can get messy. Here's how to keep it clean.
UTM Parameters
Append UTM tags to every QR destination URL. At minimum, use utm_source=qr, utm_medium=print, and utm_campaign=[campaign-name]. This lets Google Analytics (or any analytics platform) attribute sessions, conversions, and revenue to the QR channel. For a detailed walkthrough, see our guide on how to track QR code scans.
Unique Coupon Codes
For offline conversions or scenarios where users might not convert immediately, embed a unique coupon or promo code on the QR landing page. When the code is redeemed — online or in-store — revenue is attributed back to the QR campaign. This method captures conversions that happen days or weeks after the initial scan.
Dedicated Landing Pages
Create QR-specific URLs (e.g., yoursite.com/menu-qr) that aren't linked from anywhere else. All traffic to that page is QR-attributed by definition. This is the simplest attribution method and works even without UTM parameters, though using both together gives the most complete picture.
Multi-Touch Attribution
In reality, a customer might see your brand on social media, then scan your QR code in-store, then convert via email. Multi-touch attribution models assign partial credit to each touchpoint. If you use a platform like HubSpot, Salesforce, or GA4's data-driven attribution, the QR scan receives proportional credit rather than all-or-nothing.
Key Metrics to Track
ROI is the headline number, but it's built from several component metrics. Tracking these individually lets you diagnose why a campaign succeeded or failed, not just whether it did.
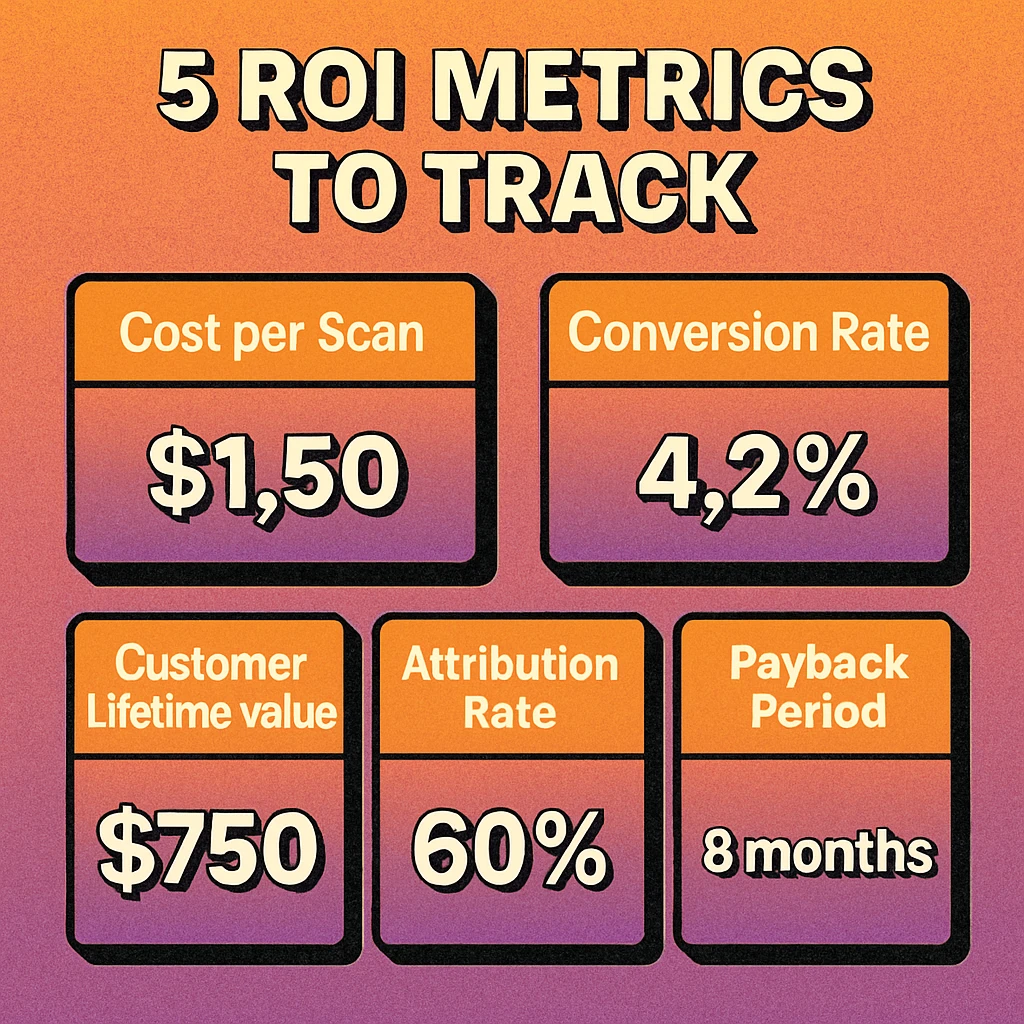
Cost Per Scan (CPS)
Total campaign cost divided by total scans. This tells you how efficiently the QR placement drives engagement. A billboard campaign costing $3,000 that generates 600 scans has a CPS of $5.00. A product insert costing $200 that generates 400 scans has a CPS of $0.50. Lower is better, but context matters — the billboard may reach a different audience segment worth the premium.
Industry average for print QR campaigns: $0.25 – $3.00 per scan.
Scan-to-Conversion Rate
The percentage of scans that result in a desired action: a purchase, signup, download, or form submission. Typical QR scan-to-conversion rates range from 5% to 25%, depending on the offer strength and landing page quality. A 15% conversion rate is considered strong for most consumer campaigns.
Customer Lifetime Value (CLV)
A single QR-driven purchase might be worth $20, but if that customer returns for ten more purchases over the next year, the true value is $220. Factoring CLV into your ROI calculation dramatically changes the picture for campaigns focused on customer acquisition rather than one-time transactions.
Use CLV when your QR campaign targets new customer acquisition.
Payback Period
How long until cumulative revenue from the QR campaign exceeds its total cost. For a campaign that cost $1,000 and generates $400/month in attributed revenue, the payback period is 2.5 months. Shorter payback periods mean faster capital recovery and lower risk. Most well-optimised QR campaigns pay back within 1–3 months.
| Metric | Formula | Good Benchmark | What It Tells You |
|---|---|---|---|
| CPS | Cost ÷ Scans | < $1.50 | Placement efficiency |
| Conversion Rate | Conversions ÷ Scans | > 10% | Offer & landing page quality |
| CLV | Avg. revenue per customer × retention period | Varies by industry | Long-term campaign value |
| Payback Period | Cost ÷ Monthly revenue | < 3 months | Capital recovery speed |
| ROI | (Revenue − Cost) ÷ Cost | > 200% | Overall campaign profitability |
Benchmarking QR Campaign Performance
Raw ROI numbers are most useful when compared against something — your previous campaigns, industry averages, or alternative channels. Here's how to build a benchmarking practice.
Compare Against Alternative Channels
If you're running QR codes alongside email, social ads, and direct mail, calculate ROI for each channel using the same formula. This apples-to-apples comparison reveals where your marketing budget works hardest. In many retail and hospitality contexts, QR campaigns outperform direct mail by 3–5x on a cost-per-acquisition basis because the scan intent is higher — the customer is already at the point of purchase.
Track Trends Over Time
A single campaign's ROI is a snapshot. Monthly or quarterly trend data is a trajectory. If your cost per scan is dropping while conversion rates hold steady, your placement strategy is improving. If conversion rates are declining despite stable scan volume, the problem is on the landing page, not the QR code.
Segment by Placement
Not all QR placements perform equally. Use different dynamic QR codes (or different UTM campaigns) for each placement: one for packaging, one for in-store signage, one for print ads. This lets you compare CPS and conversion rate by placement type and reallocate budget to the placements that deliver the strongest returns.
Start Tracking QR Code Performance
Generate dynamic QR codes with built-in scan tracking. See every scan, measure what matters, and prove your ROI.
Case Study Examples
The following examples use realistic sample numbers to show how ROI calculation works across different business contexts.
Case 1: E-Commerce Product Insert
An online retailer includes a QR code card in every shipped package linking to a "reorder with 15% off" landing page.
- Volume: 20,000 inserts over 6 months
- Costs: Design $75, printing $320, dynamic QR service $174 (6 months at $29/mo) = $569 total
- Scans: 1,800 (9% scan rate)
- Conversions: 378 reorders (21% conversion rate)
- Average order value: $48
- Revenue: $18,144
- ROI: (($18,144 − $569) ÷ $569) × 100% = 3,088%
Product inserts are among the highest-ROI QR placements because they reach customers who have already purchased and are predisposed to buy again.
Case 2: Event Sponsorship Banner
A SaaS company places a QR code on a conference banner linking to a free trial signup page.
- Costs: Banner design and printing $450, event sponsorship (QR portion) $2,000, dynamic QR $29 = $2,479 total
- Scans: 340
- Trial signups: 68 (20% conversion)
- Trial-to-paid conversion: 14 customers (20.6% of trials)
- Average annual contract value: $1,200
- First-year revenue: $16,800
- ROI: (($16,800 − $2,479) ÷ $2,479) × 100% = 578%
When factoring in a 3-year average customer lifetime, the CLV-adjusted ROI rises to over 1,700%. High-value B2B conversions make even modest scan volumes highly profitable.
Case 3: Restaurant Menu QR Code
A single-location restaurant replaces printed menus with QR codes on table stands linking to a digital menu with online ordering capability.
- Costs: Table stands $120, dynamic QR service $15/mo × 12 = $180, menu page setup $200 = $500 total
- Monthly scans: 1,100 average
- Monthly QR-driven orders: 165 (15% conversion)
- Average order value: $18
- Annual QR-attributed revenue: $35,640
- ROI: (($35,640 − $500) ÷ $500) × 100% = 7,028%
Permanent QR installations in high-traffic locations deliver exceptional ROI because the upfront cost is amortised over months or years of continuous use with no recurring print costs.
QR code ROI depends on three levers: cost control (keep campaign costs realistic), scan volume (placement and call-to-action drive engagement), and conversion quality (the landing page and offer determine revenue per scan). Optimise all three and even small campaigns can deliver triple-digit returns. Track your scans with dynamic QR codes — our guide on how to track QR code scans covers the setup step by step.
Frequently Asked Questions
A positive ROI means the campaign generated more revenue than it cost. For most marketing QR campaigns, an ROI above 200% is considered strong, meaning you earned three dollars for every one dollar spent. However, brand-awareness campaigns may show lower direct ROI but deliver long-term value through customer lifetime value and repeat engagement. The key is comparing your QR ROI against the ROI of alternative channels like print ads or direct mail.
Use dynamic QR codes with UTM parameters that tag users arriving from QR scans. Connect your QR landing pages to your analytics platform (Google Analytics, Mixpanel, etc.) and set up conversion goals or e-commerce tracking. When a user scans the code, lands on your tagged URL, and completes a purchase or signup, the revenue is attributed to the QR campaign. For offline conversions, use unique coupon codes embedded in the QR destination.
Include all costs directly associated with the QR campaign: design and branding of the QR code itself, dynamic QR service subscription fees, printing costs for physical materials (flyers, packaging, signage), distribution costs, and any landing page development or hosting expenses. Do not include sunk costs like existing website infrastructure unless the landing page was built specifically for the QR campaign.
Scan volumes vary enormously by placement and audience. A QR code on product packaging might see 2–5% of purchasers scan it. A well-placed restaurant table tent can achieve 15–30% scan rates. Billboard and poster campaigns typically see 0.5–3% engagement. The absolute number depends on impressions: a code on 10,000 product units with a 3% scan rate yields 300 scans. Context, call-to-action clarity, and incentive strength are the biggest drivers of scan volume.
Dynamic QR codes are essential for ROI tracking. Static QR codes encode a fixed URL and provide no scan data whatsoever — you cannot count scans, track locations, or measure conversions. Dynamic codes route through a tracking server that logs every scan with timestamps, device types, and geographic data. The small monthly cost of a dynamic QR service is almost always justified by the analytics it provides for ROI measurement.