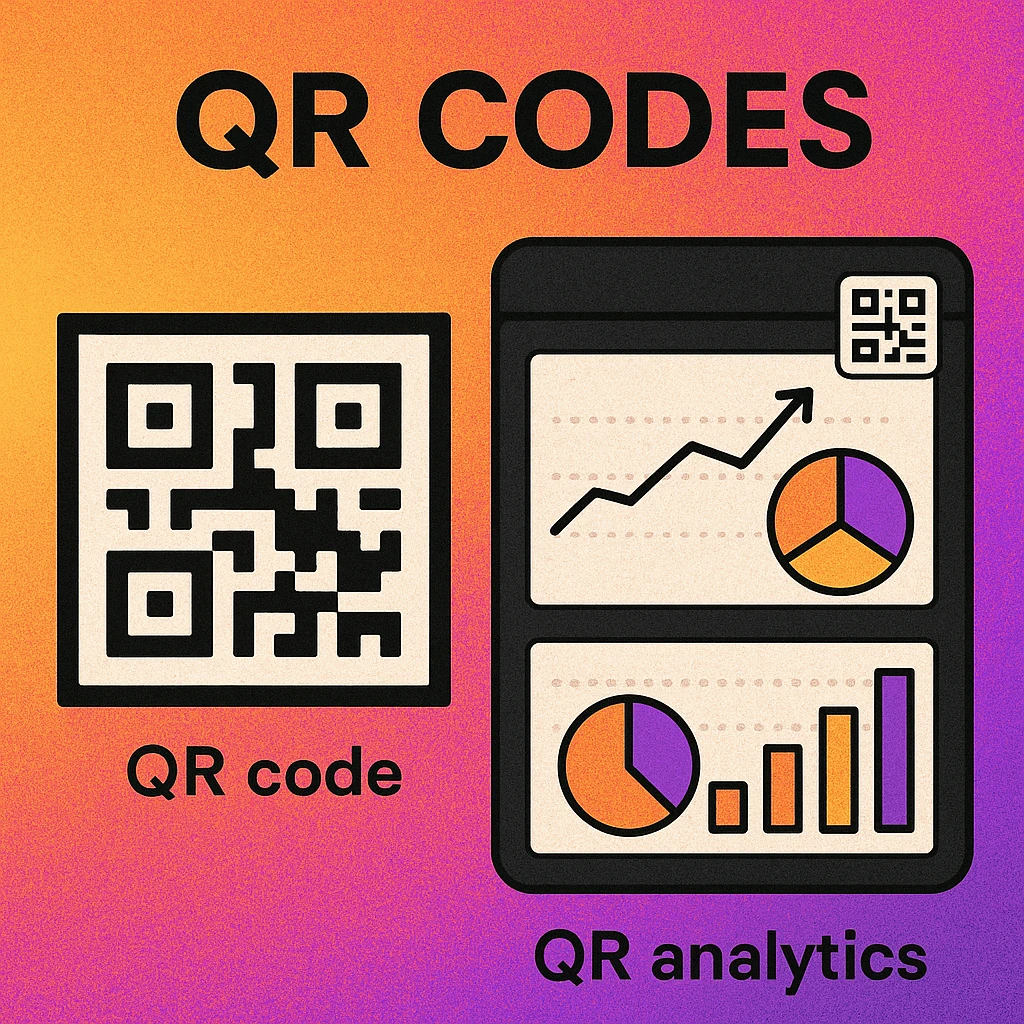
Why QR Code Tracking Matters
QR codes bridge the gap between physical media and digital experiences. A customer scans a code on a poster, product label, or business card and lands on your website, app, or landing page. But without tracking, that journey is invisible. You printed 10,000 flyers — how many people actually scanned the code? Which flyer placement performed best? Did those scans convert to sales?
Tracking transforms QR codes from passive links into measurable marketing channels. With the right setup, every scan becomes a data point: who scanned, when, where, on what device, and what they did next. This data feeds directly into your broader QR code marketing strategy and lets you optimise placements, messaging, and budget allocation based on evidence rather than guesswork.
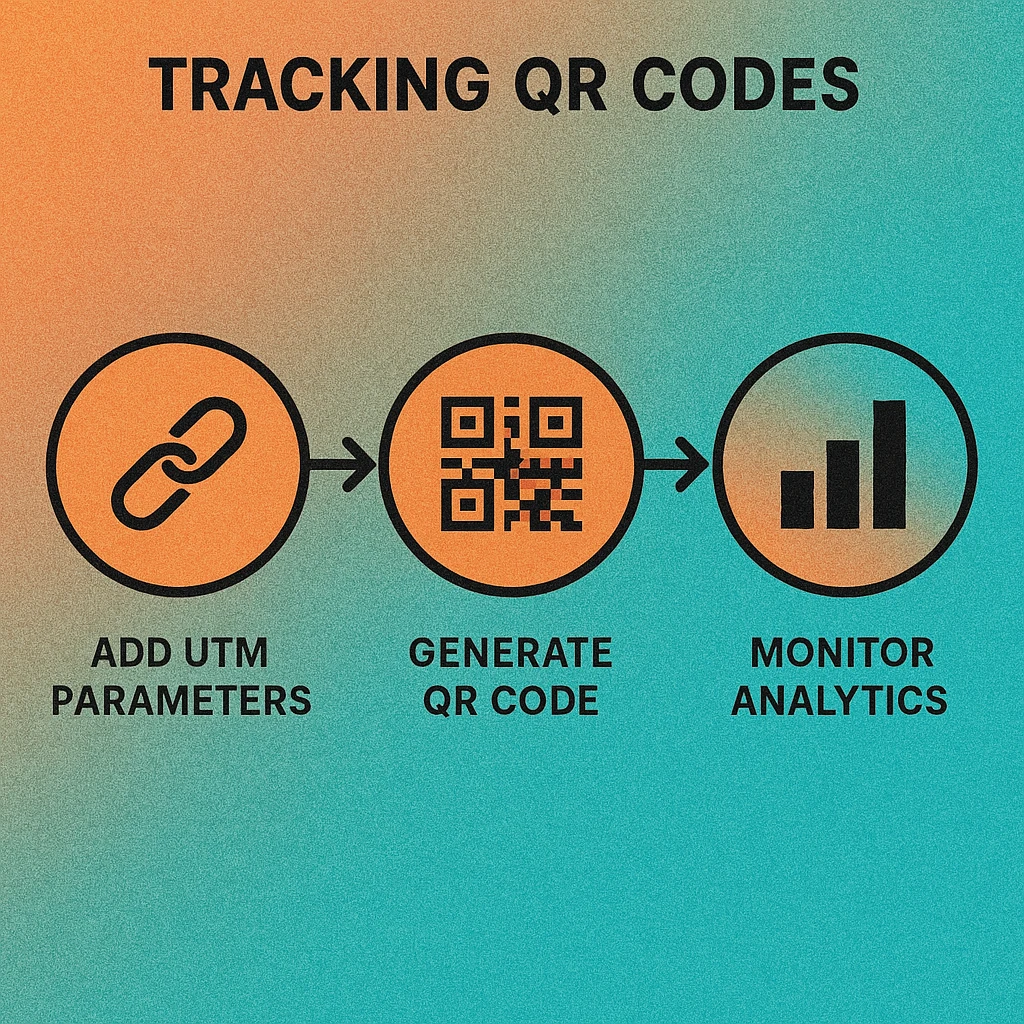
The good news: you don't need expensive software or engineering resources. The combination of UTM parameters, a web analytics platform like Google Analytics 4, and optionally a short link or dynamic QR service gives you enterprise-grade tracking for free or near-free. Let's walk through each layer.
UTM Parameters Explained
UTM (Urchin Tracking Module) parameters are tags appended to a URL that tell your analytics platform where the traffic came from. They are the foundation of QR code attribution. When someone scans your QR code and lands on a URL with UTM parameters, Google Analytics (or any analytics tool) records the visit with full campaign context.
There are five standard UTM parameters. For QR code campaigns, four are commonly used:
| Parameter | Purpose | QR Code Example |
|---|---|---|
| utm_source | Identifies the traffic source | qr_code |
| utm_medium | Identifies the marketing medium or channel | print, packaging, signage |
| utm_campaign | Names the specific campaign or promotion | spring_sale_2026, product_launch_v2 |
| utm_content | Differentiates placements within a campaign | poster_lobby, flyer_front, table_tent |
A complete tracked URL looks like this:
Encode this full URL (with parameters) into your QR code. When scanned, the visitor arrives at your landing page and your analytics platform captures every UTM value automatically. No additional code or configuration is needed on the landing page — GA4 reads UTM parameters natively.
Use a consistent naming convention across all campaigns. Lowercase everything, use underscores instead of spaces, and document your taxonomy in a shared spreadsheet. Inconsistent naming (e.g., QR_Code vs qr-code vs qrcode) creates fragmented data that is painful to reconcile later.
For a quick way to generate QR codes with UTM-tagged URLs, use our URL QR code generator — just paste the full tagged URL and download the code instantly.
Google Analytics 4 Setup for QR Tracking
Google Analytics 4 is the most widely used free analytics platform, and it handles UTM-tagged QR traffic out of the box. No special configuration is required to capture the data — but you do need to know where to find it and how to build useful reports.
Setting Up GA4 for QR Code Tracking
Build your UTM URL. Use Google's free Campaign URL Builder or construct the URL manually. Set utm_source=qr_code, choose an appropriate medium, name your campaign, and add a content tag for placement-level tracking.
Generate the QR code. Paste the full UTM-tagged URL into your QR code generator. The generator encodes the entire URL, parameters included, into the QR pattern. Download as PNG or SVG for print.
Verify in GA4 Realtime. Scan the QR code yourself and check GA4's Realtime report (Reports > Realtime). You should see your visit appear with the correct source, medium, and campaign values within seconds. If the parameters don't appear, double-check the URL encoding.
Build a Traffic Acquisition report. Navigate to Reports > Acquisition > Traffic acquisition. Add a secondary dimension for "Session campaign" or "Session source / medium." Filter by qr_code in the source dimension to isolate all QR-driven traffic.
Create a custom Exploration. For advanced analysis, open GA4 Explorations and build a free-form report with dimensions: Source, Medium, Campaign, Content, Landing page. Add metrics: Sessions, Engaged sessions, Conversions, Revenue. This gives you a complete QR performance dashboard you can save and revisit.
If you've set up conversion events in GA4 (purchases, sign-ups, form submissions), you can directly attribute those conversions to specific QR code placements. This is the data you need when building a QR code ROI measurement framework.
Short Link Services & Redirect Tracking
UTM parameters make URLs long and complex, which increases the density (and therefore the minimum print size) of your QR code. Short link services solve this by creating a compact redirect URL that forwards to your full tagged destination.
Popular short link services for QR tracking include Bitly, Rebrandly, Short.io, and QR-specific platforms that bundle link shortening with code generation. The redirect server logs every click (scan) independently of your web analytics, giving you a second layer of tracking data.
What Short Links Add
- Lower QR density: A 20-character short URL produces a simpler, more scannable QR pattern than a 150-character UTM URL. This is critical for small print sizes.
- Redirect-level analytics: The short link service records timestamp, IP-based geolocation, device type, operating system, browser, and referrer for every redirect — before the visitor even reaches your site.
- Link editability: Some services let you change the destination URL after the QR code has been printed, turning a static code into an effectively dynamic one.
- Custom branded domains: Use your own domain (e.g.,
go.yourbrand.com/spring) for a more professional appearance and higher scan trust.
When using a short link, make sure the redirect destination still includes your UTM parameters. The short URL replaces the long URL in the QR code, but the final landing page URL (after redirect) must contain the UTM tags for your analytics platform to record campaign attribution. Most short link services preserve query parameters through the redirect automatically.
Generate Trackable QR Codes Free
Paste your UTM-tagged URL, customise the design, and download your QR code in seconds. No account needed.
Key Metrics to Monitor
Once tracking is live, focus on the metrics that actually inform decisions. Not every data point is equally useful. Here are the six metrics that matter most for QR code campaigns:
| Metric | What It Tells You | Where to Find It |
|---|---|---|
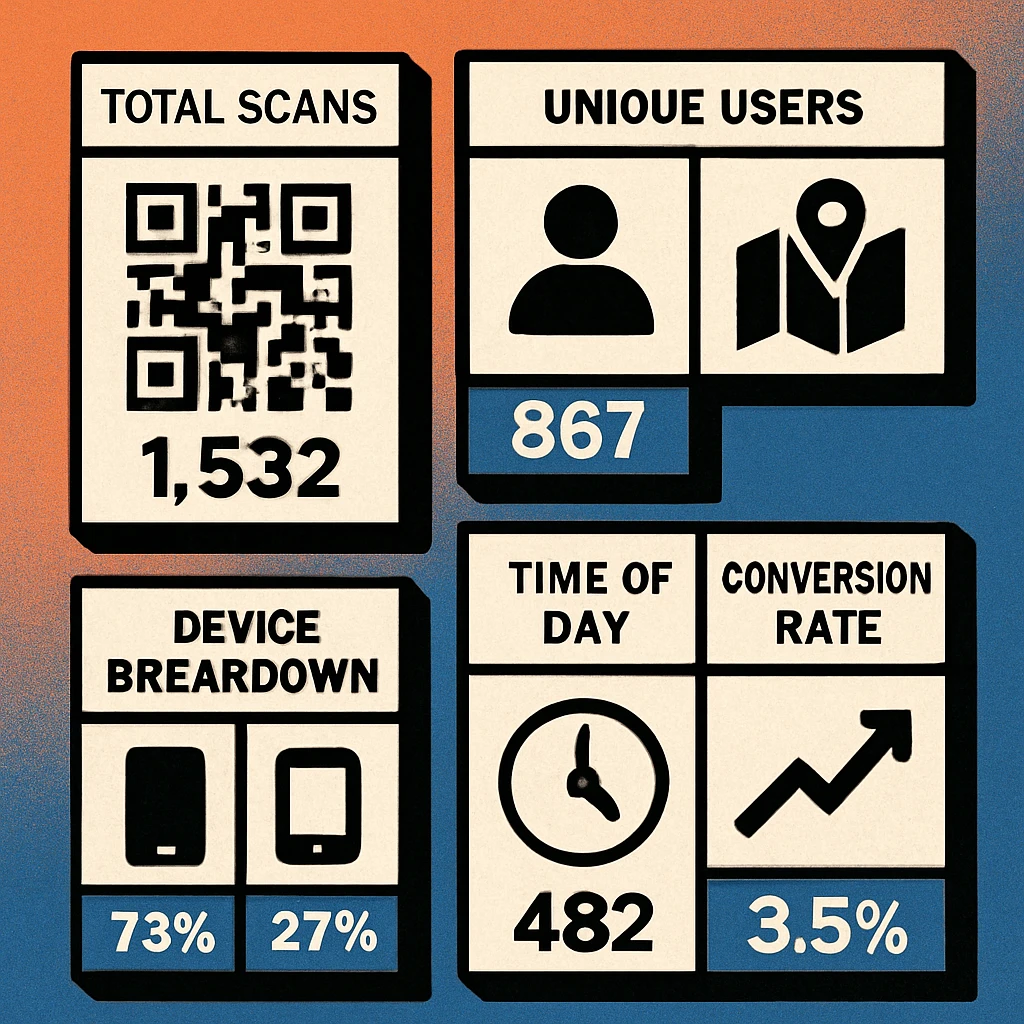
| Total Scans | Raw volume of QR code interactions across all placements | Short link dashboard or GA4 sessions filtered by source |
| Unique Users | Number of distinct individuals who scanned (vs. repeat scans by the same person) | GA4 "Total users" metric or short link unique clicks |
| Location | Geographic distribution of scanners — city, region, or country level | GA4 Demographics > Location or short link geo report |
| Device & OS | iOS vs Android split, mobile vs tablet — informs landing page optimisation | GA4 Tech > Platform or short link device report |
| Time of Day | When scans peak — morning commute, lunch hour, evening — informs placement strategy | GA4 custom Exploration with hour dimension, or short link time chart |
| Conversion Rate | Percentage of scanners who completed a goal action (purchase, sign-up, download) | GA4 conversion events filtered by QR source |
Total scans gives you reach. Unique users corrects for repeat scanners (someone scanning the same restaurant menu QR code daily is one customer, not thirty). Location and time-of-day data reveal which physical placements are performing — a poster in the lobby might get three times the scans of one in the stairwell. Device split tells you whether your landing page needs to prioritise iOS or Android optimisation. And conversion rate is the metric that ultimately determines whether your QR campaign is generating business value.
Scan-to-conversion rates vary widely by industry and context. E-commerce QR campaigns typically see 2–8% conversion rates. Restaurant menu QR codes can exceed 30% for ordering flows. The key is not hitting a universal benchmark but improving your own rate over time through iterative placement and landing page optimisation.
Attribution Models for QR Campaigns
Attribution is the process of assigning credit for a conversion to the marketing touchpoint that drove it. For QR codes, this gets interesting because a scan is often one step in a multi-touch customer journey. Someone might see your poster, scan the QR code, browse your site, leave, see a retargeting ad, and then buy. Which channel gets credit?
Last-Click Attribution
The simplest model: 100% of the conversion credit goes to the last touchpoint before purchase. If the customer's final visit before buying was the QR scan, the QR campaign gets full credit. This is GA4's default for most standard reports. It works well when QR codes are your primary or only acquisition channel, but undervalues QR when it serves as a top-of-funnel discovery mechanism.
First-Click Attribution
All credit goes to the first touchpoint. If a customer discovered your brand by scanning a QR code on a product package but converted two weeks later through a Google search, the QR code gets full credit. This model is useful for measuring QR's role in awareness and discovery, which is often its primary function in physical-to-digital campaigns.
Data-Driven Attribution
GA4's recommended model uses machine learning to distribute credit across all touchpoints based on their actual contribution to conversion probability. This is the most accurate model for multi-channel campaigns but requires sufficient conversion volume (typically 300+ conversions per month) to work reliably. For smaller campaigns, last-click or first-click is more practical.
Position-Based (U-Shaped)
Assigns 40% credit to the first touch, 40% to the last touch, and distributes the remaining 20% across middle interactions. This is a good compromise model for QR campaigns that serve as an introduction point — it gives the QR code significant credit for initiating the journey while also crediting the closing channel.
Whichever model you choose, consistency matters more than perfection. Pick one model, apply it across all campaigns, and use it for comparative analysis. Switching models mid-campaign makes historical comparisons meaningless. For a deeper dive into connecting attribution to financial outcomes, see our guide on QR code ROI measurement.
Dynamic vs Static QR Codes for Tracking
The choice between dynamic and static QR codes has a significant impact on what you can track and how flexibly you can manage campaigns after deployment.
| Capability | Static QR Code | Dynamic QR Code |
|---|---|---|
| Change destination after print | No | Yes |
| UTM tracking via analytics | Yes | Yes |
| Scan count at QR layer | No | Yes |
| Device & OS data at QR layer | No | Yes |
| Location data at QR layer | No | Yes |
| Works offline / without server | Yes | No |
| QR pattern complexity | Higher | Lower |
| Ongoing cost | Free | Varies |
Static QR codes encode the destination URL directly. The URL is baked into the QR pattern and cannot be changed. Tracking relies entirely on UTM parameters and your web analytics platform. Static codes are free, require no ongoing service, and work even if the generating platform goes offline. They are the right choice for permanent applications where the destination will never change — a company website URL, a product manual, or a contact card.
Dynamic QR codes encode a short redirect URL managed by a QR platform. The platform logs every scan with metadata (timestamp, device, location, unique visitor flag) and lets you change the redirect destination at any time without reprinting. This makes them ideal for campaigns, seasonal promotions, and A/B testing. The trade-off is ongoing dependence on the platform — if the service goes down or you stop paying, the QR code stops working.
For most marketing campaigns, use dynamic QR codes with UTM parameters on the final destination. This gives you two independent layers of tracking: the QR platform captures scan-level data (device, location, time), and your web analytics captures session-level data (engagement, conversions, revenue). Together, they provide a complete picture from scan to sale.
Whether you choose static or dynamic, the principle is the same: never deploy a QR code without a tracking mechanism. Even a simple utm_source=qr_code parameter on a static URL is infinitely better than an untagged link. For practical guidance on building URLs for your codes, see our URL QR code generator guide.
Frequently Asked Questions
Yes, but only indirectly. A static QR code encodes a fixed URL, so the code itself cannot count scans. However, if the URL includes UTM parameters, your web analytics platform (such as Google Analytics 4) will record each visit with full campaign attribution. You won't get scan-level metadata like device type from the QR code itself, but your analytics will capture browser, OS, location, and referral data from the landing page visit.
A static QR code points directly to your destination URL and cannot be changed after printing. A dynamic QR code points to an intermediate redirect URL that you control. Dynamic codes let you change the destination without reprinting, and the redirect server logs every scan with metadata such as timestamp, device type, operating system, approximate location, and unique vs. repeat visitor status. Dynamic codes provide richer tracking data at the QR layer, while static codes rely entirely on your web analytics.
At minimum, use three: utm_source (e.g., "qr_code"), utm_medium (e.g., "print" or "packaging"), and utm_campaign (e.g., "spring_sale_2026"). For more granular tracking, add utm_content to distinguish between different QR code placements within the same campaign — for example, "flyer_front" vs. "flyer_back" or "poster_lobby" vs. "poster_window".
In GA4, navigate to Reports > Acquisition > Traffic acquisition. Filter or search by the utm_source value you assigned to your QR codes (e.g., "qr_code"). You can then break down the data by campaign, medium, or content to see scan volume, engagement metrics, and conversions for each QR placement. For deeper analysis, create a custom Exploration with dimensions for Source, Medium, Campaign, and Landing page.
Scan rates vary enormously by context. A QR code on a product package might see a 2–5% scan rate relative to units sold. A QR code on a billboard or poster in a high-traffic area might get hundreds of scans per day but represent a tiny fraction of total impressions. Restaurant table QR codes can see 30–60% engagement. The key is not hitting a universal benchmark but comparing your own rates across placements, time periods, and campaigns.