Key QR Code Statistics at a Glance
Before we dive into the details, here are the headline numbers that define the QR code landscape in 2026. These figures paint a clear picture: QR codes are not a passing trend — they are a permanent fixture of how consumers interact with the physical and digital worlds.
These numbers come from a combination of industry reports, mobile analytics platforms, and market research. If you are new to QR codes and want to understand the technology behind these numbers, start with our guide to what a QR code is and how it works.
Global QR Code Growth (2020–2026)
The growth trajectory of QR codes over the past six years tells a compelling story. What started as a pandemic-driven necessity has become a deeply ingrained consumer behavior. Global QR code scan volumes have increased from approximately 1.0 billion in 2020 to an estimated 2.7 billion in 2026 — a 170% increase in just six years.
The steepest growth occurred between 2020 and 2022, driven by pandemic-era contactless needs. But the important insight is that the curve did not flatten after restrictions lifted. Consumers kept scanning. Businesses kept deploying. The 26% year-over-year growth rate in 2025–2026 suggests that QR codes have entered a self-sustaining adoption cycle, powered by mobile payments, marketing innovation, and integration into everyday products.
The global QR code market — which includes hardware, software, and services — is valued at approximately $15.8 billion in 2026, up from $10.1 billion in 2023. Analysts project it will surpass $21 billion by 2028, representing a compound annual growth rate (CAGR) of around 16%. To understand the technical foundation behind this growth, our history of QR codes traces the journey from a Japanese auto parts factory to a global standard.
QR Code Adoption by Industry
QR code adoption varies significantly across sectors. Industries with strong consumer-facing touchpoints and a need for bridging physical-to-digital experiences lead the way, while sectors with longer digital transformation timelines are catching up.
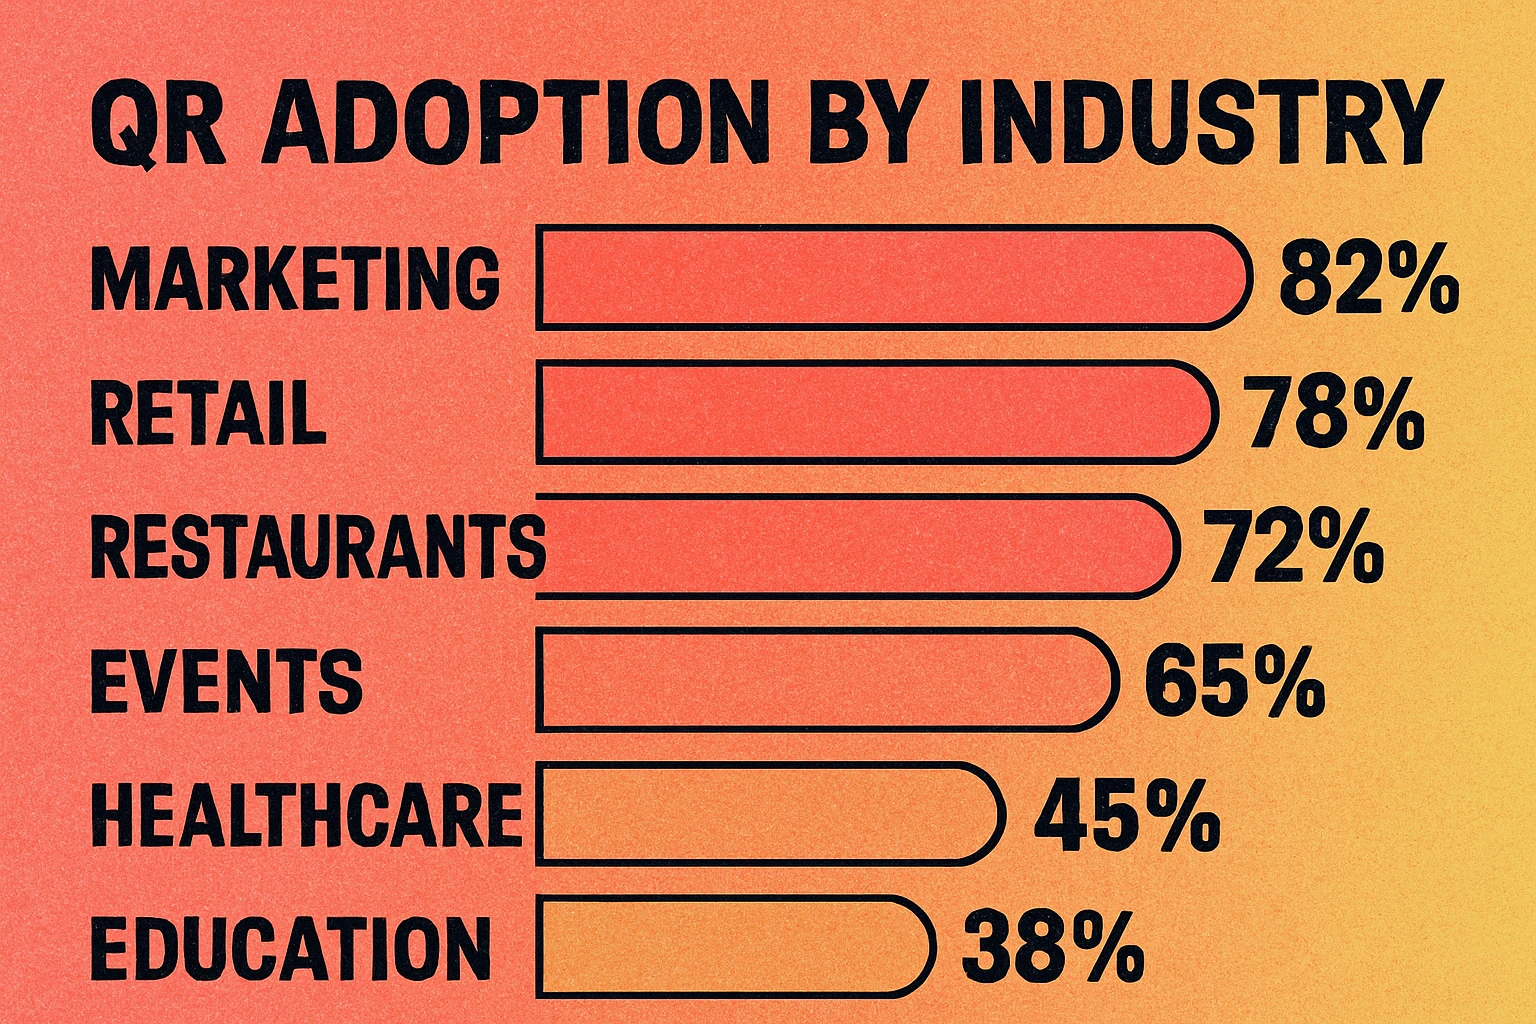
| Industry | Adoption Rate | Primary Use Cases |
|---|---|---|
| Marketing | 82% | Campaign tracking, print-to-digital, lead generation, social media links |
| Retail | 78% | Product info, mobile payments, loyalty programs, inventory management |
| Restaurants | 72% | Digital menus, table ordering, contactless payments, reviews |
| Events | 65% | Ticketing, check-in, networking, schedules, feedback collection |
| Healthcare | 45% | Patient check-in, medication info, appointment scheduling, records access |
| Education | 38% | Resource sharing, attendance tracking, interactive materials, campus navigation |
Marketing and advertising leads at 82% adoption, which is unsurprising given that QR codes solve one of marketing's oldest problems: connecting offline media to trackable digital experiences. A billboard, magazine ad, or product package with a QR code becomes a measurable touchpoint. If you are building a QR-driven marketing campaign, our QR code marketing strategy guide walks through best practices from placement to analytics.
Retail follows closely at 78%, with QR codes appearing on shelf labels, receipts, packaging, and storefronts. The technology lets retailers provide detailed product information without taking up physical space — a major advantage in store layouts where every square centimeter of shelf space counts.
Restaurants at 72% saw the most dramatic acceleration during the pandemic, when digital menus replaced physical ones almost overnight. Most restaurants that made the switch have stayed with QR menus, citing reduced printing costs, the ability to update pricing instantly, and the option to upsell through digital interfaces.
Healthcare and education sit at the lower end but are growing steadily. Both sectors face regulatory and institutional barriers that slow technology adoption, but the use cases are compelling — from patient intake forms to interactive classroom materials.
Consumer Scanning Behavior
Understanding who scans, when, and why is critical for any business deploying QR codes. The data reveals several clear patterns:
- Age demographics: Adults 18–34 are the most active scanners, with 68% reporting they scan QR codes at least once a week. The 35–54 bracket is close behind at 54%. Even among consumers aged 55+, weekly scanning has reached 31%, up from just 12% in 2021.
- Scan motivation: The top reason consumers scan a QR code is to access a website or product information (47%), followed by making a payment (23%), redeeming a coupon or offer (16%), and connecting to Wi-Fi (8%).
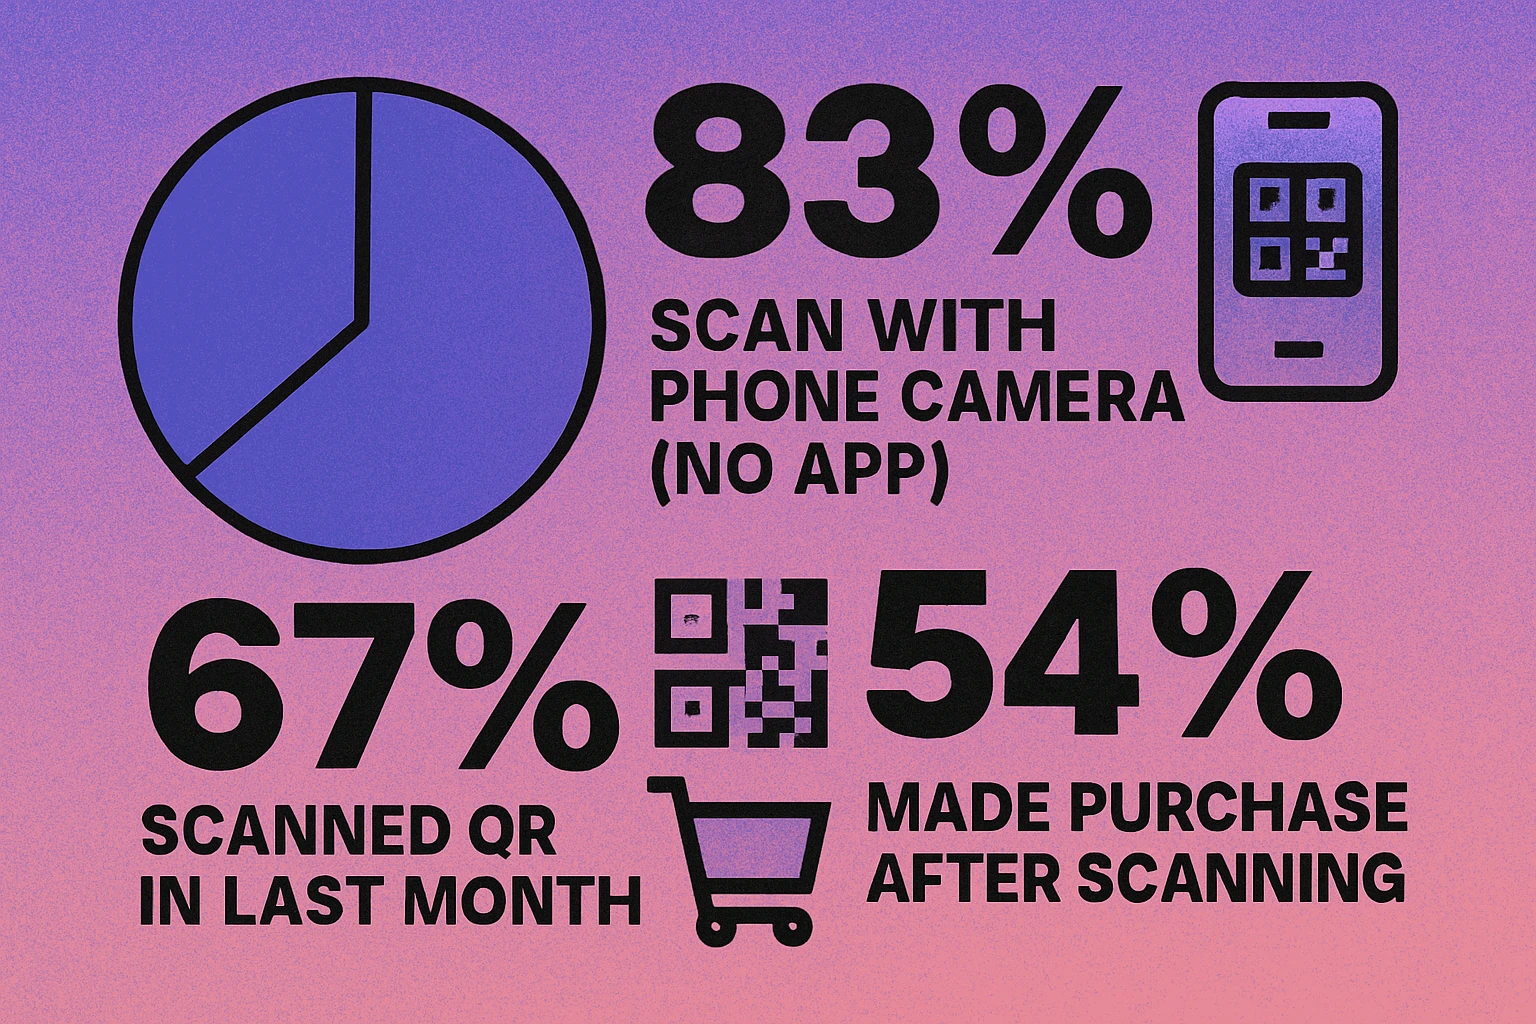
- Device preference: 98% of scans happen via smartphone. Of those, roughly 62% use the native camera app (both iOS and Android have supported built-in QR scanning since 2017–2018), while 38% use a dedicated QR scanner or a brand-specific app.
- Location: 41% of scans happen inside retail stores, 22% at restaurants and cafes, 15% at events, and the remaining 22% across other environments including transit, healthcare facilities, and outdoor signage.
The "QR code literacy gap" is closing fast. Even demographics that were once reluctant to scan — particularly consumers over 55 — have adopted the behavior at meaningful rates. You can now assume that the vast majority of your audience knows how to use a QR code.
One of the most interesting behavioral trends is repeat scanning. Consumers who scan a QR code and have a positive experience (fast load time, relevant content, clear value) are 74% more likely to scan another code from the same brand within 30 days. This means the quality of your landing page matters as much as the QR code placement itself.
The difference between a static and dynamic QR code becomes important here. Dynamic codes let you track scan analytics and update the destination URL without reprinting, which is essential for measuring and optimizing consumer engagement over time.
QR Codes in Payments
Perhaps no single use case has driven QR code growth more than mobile payments. Global QR code payment transaction volume is estimated at $3.2 trillion in 2026, up from $2.4 trillion in 2024. Asia-Pacific continues to dominate this segment, accounting for roughly 65% of all QR-based payment transactions, but adoption in North America and Europe is accelerating rapidly.
Regional Payment Breakdown
- China: Alipay and WeChat Pay process over $1.5 trillion in QR transactions annually. QR payments are so embedded in daily life that many vendors no longer accept cash as a practical matter.
- India: The Unified Payments Interface (UPI) system processed over 14 billion QR-based transactions in 2025 alone, making India the fastest-growing QR payments market in the world.
- United States: QR payment adoption reached 32% of smartphone users in 2026, driven by Apple Pay, Google Pay, and merchant-specific apps. The number is expected to hit 40% by late 2027.
- Europe: The European Payments Initiative (EPI) and individual country-level systems are driving QR payment adoption, currently at 28% of smartphone users across the EU.
The payment trend is particularly significant because it creates a feedback loop: consumers who use QR codes for payments become comfortable scanning QR codes in general, which increases engagement with marketing, informational, and navigational QR codes. Every QR payment normalizes the behavior further.
Ready to Leverage These Trends?
Create professional QR codes for your business in seconds. Track scans, customize designs, and download in any format.
COVID's Lasting Impact on QR Adoption
The COVID-19 pandemic was the single largest accelerator of QR code adoption in history. Between March 2020 and December 2021, global QR code generation increased by an estimated 238%. But the real story is what happened after: the behavior stuck.
Pre-pandemic, QR codes were a niche technology in most Western markets. Many consumers had never scanned one. The pandemic changed that by creating urgent, practical reasons to scan — restaurant menus, contactless check-ins, vaccination records, and digital health passes. By the time restrictions were lifted, scanning a QR code had become second nature for billions of people.
Post-Pandemic Retention
Industry data shows that 87% of consumers who started scanning QR codes during the pandemic continued to do so regularly in 2024 and 2025. The behaviors that were adopted out of necessity — scanning a menu, checking in at a venue, making a contactless payment — persisted because they were genuinely more convenient than the alternatives they replaced.
Restaurants provide the clearest example. A 2025 survey found that 64% of diners now prefer digital menus accessed via QR code over printed menus, citing the ability to see photos, allergen information, and real-time pricing. What started as a hygiene measure became a better customer experience.
The pandemic did not create QR code demand — it pulled forward five to seven years of adoption into an 18-month window. The technology was ready; consumer willingness was the bottleneck, and COVID removed it permanently.
Predictions for 2026–2027
Based on current trajectories and emerging technology integrations, here is where QR codes are headed over the next 12 to 18 months:
1. AR-Enhanced QR Experiences
Augmented reality layered onto QR code scans is moving from experimental to practical. Expect to see product packaging QR codes that trigger 3D product views, virtual try-ons, and interactive tutorials. Early adopters in fashion, cosmetics, and furniture retail are already deploying these experiences at scale.
2. QR Codes in Smart Packaging
The EU's Digital Product Passport regulation, taking full effect in 2027, will require detailed product sustainability and supply chain data to be accessible via QR codes on packaging. This regulatory push will make QR codes mandatory on millions of consumer products across Europe, with ripple effects globally.
3. Dynamic QR Code Dominance
The share of dynamic QR codes (codes whose destination can be changed after printing) is projected to grow from 45% of all generated codes in 2025 to over 60% by the end of 2027. As businesses become more sophisticated in their QR strategies, the ability to track, update, and A/B test code destinations becomes essential. Learn about the difference in our static vs. dynamic QR code comparison.
4. QR Payments Overtake Card Tap
In at least three major Asian markets, QR code payments are expected to surpass contactless card payments in total transaction volume by mid-2027. In Western markets, the crossover is further out, but the gap is narrowing rapidly, particularly for small-value transactions.
5. Standardization of QR in Healthcare
Healthcare QR adoption, currently at 45%, is projected to reach 60% by 2027 as electronic health record (EHR) systems increasingly integrate QR-based patient identification, prescription verification, and insurance processing.
What This Means for Your Business
If you are reading this article, you are probably already considering QR codes for your business — or looking for data to justify expanding an existing QR strategy. Here is what the 2026 statistics tell us about where to focus:
- The audience is ready. With over 110 million monthly scanners in the US alone and steadily growing adoption among older demographics, you no longer need to "educate" your audience on QR codes. Just provide a clear reason to scan.
- Track everything. Use dynamic QR codes so you can measure scan rates, geographic distribution, time-of-day patterns, and device types. The data is as valuable as the scans themselves.
- Optimize the landing experience. With 74% repeat scan rates tied to positive first experiences, your mobile landing page matters more than the QR code design. Fast load times, mobile-first layouts, and immediate value are non-negotiable.
- Think beyond marketing. Payments, customer support, product authentication, employee onboarding, facility navigation — QR codes are a general-purpose bridge between physical objects and digital information. Look for friction points in your customer journey where a scannable code could remove a step.
- Start with your highest-traffic touchpoint. Identify the physical location or printed material that gets the most customer attention and deploy a QR code there first. Measure results, iterate, then expand.
Our complete QR code guide covers everything from choosing the right code type to designing for maximum scannability. It is the best next step if you are moving from data to action.
The question is no longer "should we use QR codes?" — it is "where in our business will QR codes deliver the most value?" The statistics make the case. The execution is up to you.
Turn Data Into Action
Create your first QR code in under 30 seconds. Free, no account needed, download as PNG or SVG.
Frequently Asked Questions
An estimated 2.7 billion QR code scans occur globally each year as of 2026. In the United States alone, over 110 million smartphone users scan at least one QR code per month, representing roughly 45% of the adult population with a smartphone.
Marketing and advertising leads QR code adoption at 82%, followed by retail at 78% and restaurants at 72%. These industries use QR codes for everything from product information and promotions to digital menus and loyalty programs.
Yes. The global QR code market is valued at approximately $15.8 billion in 2026 and is projected to reach $21 billion by 2028. Annual scan volumes have grown roughly 26% year-over-year since 2022, driven by mobile payments, contactless experiences, and marketing innovation.
Approximately 98% of all QR code scans happen via smartphone cameras or built-in scanner apps. Both iOS and Android have supported native QR code scanning since 2017–2018, eliminating the need for third-party apps and significantly boosting adoption.